Project Overview and Topology On this page The Topology View in Haddock gives you a complete interactive map of your project’s running services. You can control the lifecycle of your project, visually organize service nodes, and inspect container details in real time.
Accessing the Project Overview# From the dashboard:
Locate your project Click on the project name The Topology tab will open by default This tab includes:
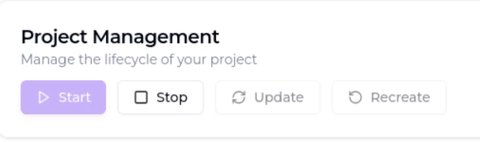
A control panel with project lifecycle actions A real-time React Flow graph of your services Toggle for service connection edges Zoom and pan controls Project Lifecycle Controls# You can manage your project directly from the top section:
Start : Boots up all servicesStop : Shuts down the projectUpdate : Pulls the latest changes and applies updatesRecreate : Rebuilds the entire container graphThe current status (Running, Stopped, etc.) is shown in the top-right badge.
Interacting with the Topology (React Flow)# You can fully manipulate the graph view:
✋ Move & Arrange Services# Click and drag nodes to any position Zoom in/out using the +/- controls or your mouse scroll Pan the view by dragging the canvas 🔌 Show/Hide Connections# Toggle the “Show Connections” switch to reveal or hide edges between services Click “Refresh” to refresh the graph Changes to layout and visibility are persisted per user and reload automatically when reopening the project.
Inspecting Services# Clicking on a service node opens a detail drawer on the right-hand side.
This drawer shows:
Service name Container status (Running / Stopped)Docker image used Port mappings, networks, and resource configuration ✅ Summary# The Topology tab gives you a full graphical overview of your project’s runtime. You can:
Start/Stop/Update/Recreate your project Visually organize and persist service layout View connections between services Inspect detailed configuration of each container